MSME Finance Gap
An Updated Estimation and Evolution of the MSME Finance Gap in Emerging Markets and Developing Economies
Chart 1: Evolution of the MSME Finance Gap
Over a 4 year period (2015 to 2019) the overall MSME finance gap has increased by over US$1.1 trillion, that is, from US$4.4 trillion to US$5.7 trillion, a 27 percent growth. Although the supply of financing has increased by US$991 billion, demand has still outpaced supply, with total demand for credit increasing by US$2.2 trillion. (see figure below). Indeed, the overall gap increased by 27 percent from 2015 to 2019, more than double the growth in GDP, which averaged 13 percent during the same period. The gap as a percentage share of GDP has increased by 2 percentage points, that is, from 17 percent in 2015 to 19 percent in 2019.
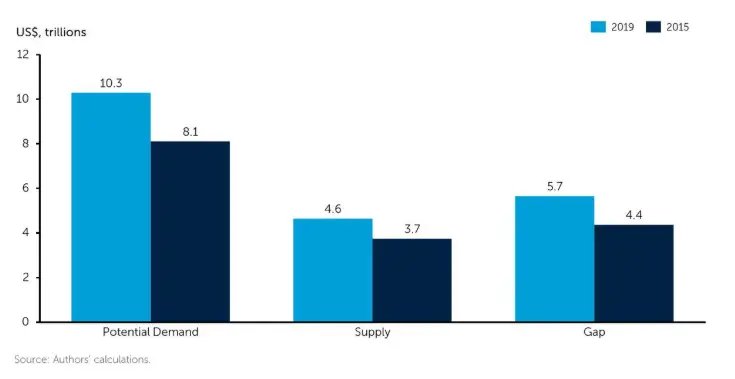
Chart 2: W-MSME Finance Gap
Women-owned businesses account for 34 percent of the MSME finance gap. The total MSME finance gap for women is estimated to be valued at US$1.9 trillion, which is over 7 percent of total GDP (figure below).

Chart 3: Evolution of the MSME Finance Gap by Region
Regional and income group variations of the MSME finance gap are a result of potential demand and supply variations, as discussed in earlier sections.

Chart 4: Growth in Supply of MSME Finance
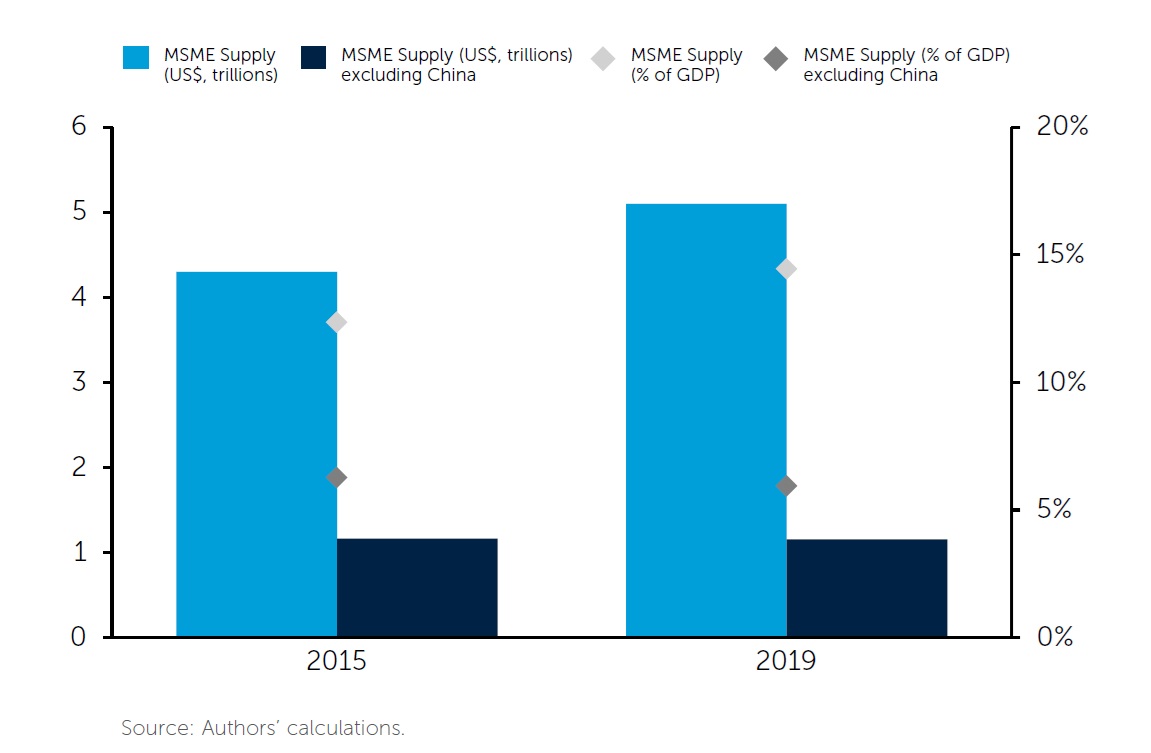
In 2019, the supply of MSME credit in EMDEs showed meaningful growth compared to the 2015 estimate. In the four-year period from 2015 to 2019, the supply of financing grew by an average annual rate of 7 percent (see figure below).37
37. All analyses presenting the growth from 2015 to 2019 in this section only consider the 119 common countries covered by both the previous and current reports. Thus, the 2015 numbers here may differ from the aggregate number presented in the previous report due to changes in country coverage.
Chart 5: Evolution of the MSME Finance Supply by Region
At the regional level, the report finds disparities, with some regions seeing a significant increase in the supply of formal finance, whereas others saw a contraction. For instance, the East Asia and Pacific (EAP) region saw a 33 percent growth in supply of formal finance as compared to the previous estimate of an 8 percent average increase per year. This was followed by South Asia at 22 percent. However, Latin America and the Caribbean (LAC) and Europe and Central Asia (ECA) both saw a contraction in supply over the 4-year period, with an approximately 4 percent and 3 percent decrease per year, respectively. Both the Middle East and North Africa (MENA) region and the Sub-Saharan Africa (SSA) saw relatively low overall growth of 7 percent and 2 percent, respectively. However, when taking into account the average growth of supply as a percentage of GDP, almost all regions stayed more or less constant, with the difference of less than 1 percentage point. However, ECA and EAP are the only exceptions, with growth in EAP being approximately 3 percentage points, and ECA, which experienced a decline of approximately 2 percentage points.

Chart 6: Growth of Potential Demand of MSME Finance
Comparing the potential demand in 2019 with that of 2015, the report finds robust growth of 27 percent over the four-year period, that is, from US$8.1 trillion to US$10.3 trillion. Over the same period, the GDP in these economies grew by an average rate of 12 percent. As a result, the potential demand, expressed as a percentage of GDP, also grew from 31 percent to 36 percent (figure below). Even after considering the case of China, potential demand grew at an even higher rate of 42 percent over the 2015-2019 period, representing an average annual increase of more than 10 percent. The change in GDP over the same period was 9 percent for the EMDEs (excluding China).
Chart 7: Evolution of the Potential Demand for MSME Finance Gap by Region
From a regional perspective, the growth in demand of MSME financing presents an interesting picture. In most regions, the demand has grown relatively modestly (figure below). However, in terms of volume, the demand for financing increased annually by approximately 10 percent in both East Asia and the Pacific as well as South Asia over the 4-year period. This stands in contrast to the annual average increase in GDP during the same time period, which was 4 percent and 7 percent, respectively. As a result, when expressed as a share of GDP, the potential demand for financing increased by only 3 percentage points in South Asia and 7 percentage points in East Asia and the Pacific. However, it shows a decline of 2 percentage points for ECA. Overall, there is an increase in demand in terms of volume across all regions, with the exception of ECA (figure below).